

Predicting Elections: Science, Gossip, or Snake Oil?
Predicting Elections: Science, Gossip, or Snake Oil?

Every political system creates unique forms of anxiety. In a representative democracy, elections can be scary. Close, high-stakes races worry just about everyone.
For instance, right about now you're probably wondering: Who's going to prevail in November?
Me too. I expect Kamala Harris to win the popular vote by a large margin and the electoral college by a small one. (I also predict a Taylor Swift effect, though celebrity endorsements haven't swayed presidential races in times past.)
The purpose of this newsletter isn't to harangue you with my opinions. Rather, I want to talk about the three main approaches to predicting elections. What do they tell us, and can we trust what they say? (I will also ding the New York Times for a terribly misleading article published last Thursday. This pains me a little; I admire the journalism in the Times.)
Why is this important?
Most of us care deeply about this year's presidential race, but should we be fretting over polls and projections? That depends on how you answer the question in my title. To the extent that polls and such are scientific, yes, we should pay attention. Gossip calls for a less invested ear. Snake oil can be safely ignored.
Predicting elections has become a big business – polling alone is now a $20 billion dollar industry in the U.S. Political campaigns sustain that industry, but so do you and I, because we listen to pundits and read the news and suffer the ads and follow the polls. Part of what motivates both campaigns and citizens is the desire to reduce uncertainty about the future.
Managing uncertainty is one that thing statistics can be particularly good at. COVID-19 is still out there, and we can't be 100% sure it won't find us, but we gain some comfort from knowing about case rates and vaccine effectiveness stats and preventive measures that have been rigorously tested. In the same way, polls and forecasts use statistical techniques to help reduce uncertainty around election outcomes. Even when the stats don't convey good news, it's comforting at least to be prepared for what lies ahead.
I'l start with the method that's least familiar to people but on the verge of becoming better known.
1. Prediction markets
On Tuesday evening, in the midst of all the commotion over the presidential debate, a small but important legal decision just barely made the news: A federal judge in Washington ruled that a company named Kalshi can allow Americans to bet on congressional elections.
People can bet on almost anything nowadays. On sites like Kalshi and Polymarket, you can bet on the number of tornados that will occur this month, the next James Bond actor (Aaron Taylor-Johnson tops the list), and whether Taylor Swift will release a new album this year (odds are against it).

Betting on political elections has been illegal in the U.S. for about a century. When it becomes widespread in the U.S. again – the Kalshi case suggests this will happen soon – the ability to predict the outcomes of U.S. elections may improve.
Why is that? When people bet on an election, the odds that bubble up can be used to predict election outcomes. Here's a simple example:
Suppose you bet on a particular candidate with 3.33 decimal odds of winning. This would mean that if you bet a dollar, and your candidate wins, the payoff is $3.33.
A betting market can only survive if bigger payoffs are tied to less likely outcomes. For instance, what's called the implied probability is the inverse of the decimal odds. Here, 1 divided by 3.33 is .30 or 30%. Your candidate has been estimated to have only a 30% chance of winning.
In short, instead of polling people to ask how they'll vote, we can look at which candidates they've put their money on. (This isn't necessarily the same thing. Someone who plans to vote for a known underdog would probably bet on the other candidate.)
Prediction markets yield surprisingly accurate predictions – more accurate than polls, in some circumstances. (There's much scholarly debate about whether or when markets outperform polls, though in some cases it's clear – for presidential races, markets were better in 2008 but worse in 2016, for instance. Markets also update more quickly than polls do.)
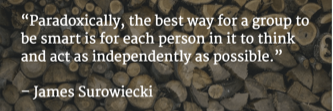
The source of market accuracy isn't fully understood but reflects in part the "wisdom of the crowd". As James Surowiecki emphasized in his 2004 bestseller The Wisdom of Crowds, a diverse group of individuals can sometimes outperform experts at predicting future events.
Why does that happen? In the case of presidential elections, the process may be complicated and reflect the behavior of over 150 million voters, but we know a lot about how our fellow voters think, because they're friends and neighbors and colleagues, plus we hear about broader trends from pundits, forecasters, pollsters, and journalists (many of whom wear more than one of these hats).
In short, the folks who bet on elections can draw from the wisdom of the crowd. (We might add too that the bettors are highly incentivized to acquire this wisdom, because they're putting up their own money.)
Prediction markets fall short to the extent that they fail to tap into the entire crowd. What we need is large, representative samples of informed voters, but that's not what these markets ordinarily attract.
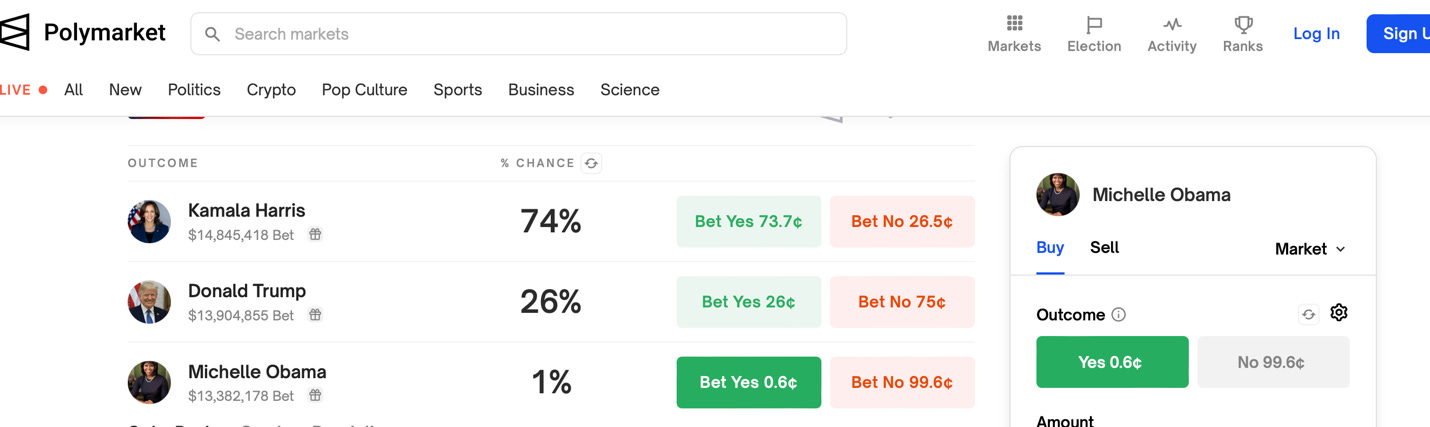
For instance, Polymarket, the largest prediction market in the world, has often been out of sync with polls and forecasts in the presidential race this year, owing most likely to sampling bias: It's illegal for Americans to use Polymarket, and bets are paid in cryptocurrency. Polymarket bettors may be highly informed, but they're not representative of American voters, and they may be selectively attuned to crypto culture.
A separate issue is that because it's a betting market, Polymarket is open to bets on just about anything. As of today, for instance, you can win $10 dollars for every 6 cents you bet that Michelle Obama will win the popular vote in November. (Polymarket gives her a 1% chance of victory.) Other choices include Ron DeSantis and Kanye West (each, if they win, would earn you $10 dollars for every penny you bet!) One problem with these impossible outcomes is that the tiny probabilities they contribute to Poylmarket's odds add up and can skew the numbers for genuine possibilities.
Prediction markets were regularly reported in major U.S. newspapers up until the early 20th century, when "scientific polling" became popular and mostly displaced them. Interest in markets perked up again with the emergence of internet-based platforms, and I expect we'll be hearing more from them soon as a result of the Kalshi decision.
2. Polls
"The officers would treat their men, make them drunk, and then raise the war whoop for General Jackson. Then the poor, staggering, drunken, and deluded creatures would sally forth for the place pointed them to vote. The result was always in favor of Jackson. I have conversed with some of them afterwards who told me they did not intend to vote that way in the proper election, they voted so just to please their officers."
This anecdote illustrates some of the haphazardness of the first straw polls, conducted in 1824. Somehow though, perhaps by luck, they accurately signaled a landslide for Jackson.
200 years later, Gallup won't get you drunk before asking you who you'll vote for, but the motivations for polling haven't changed much: If we want to know how people are going to vote, or what issues drive their voting preferences, we can just ask them directly.
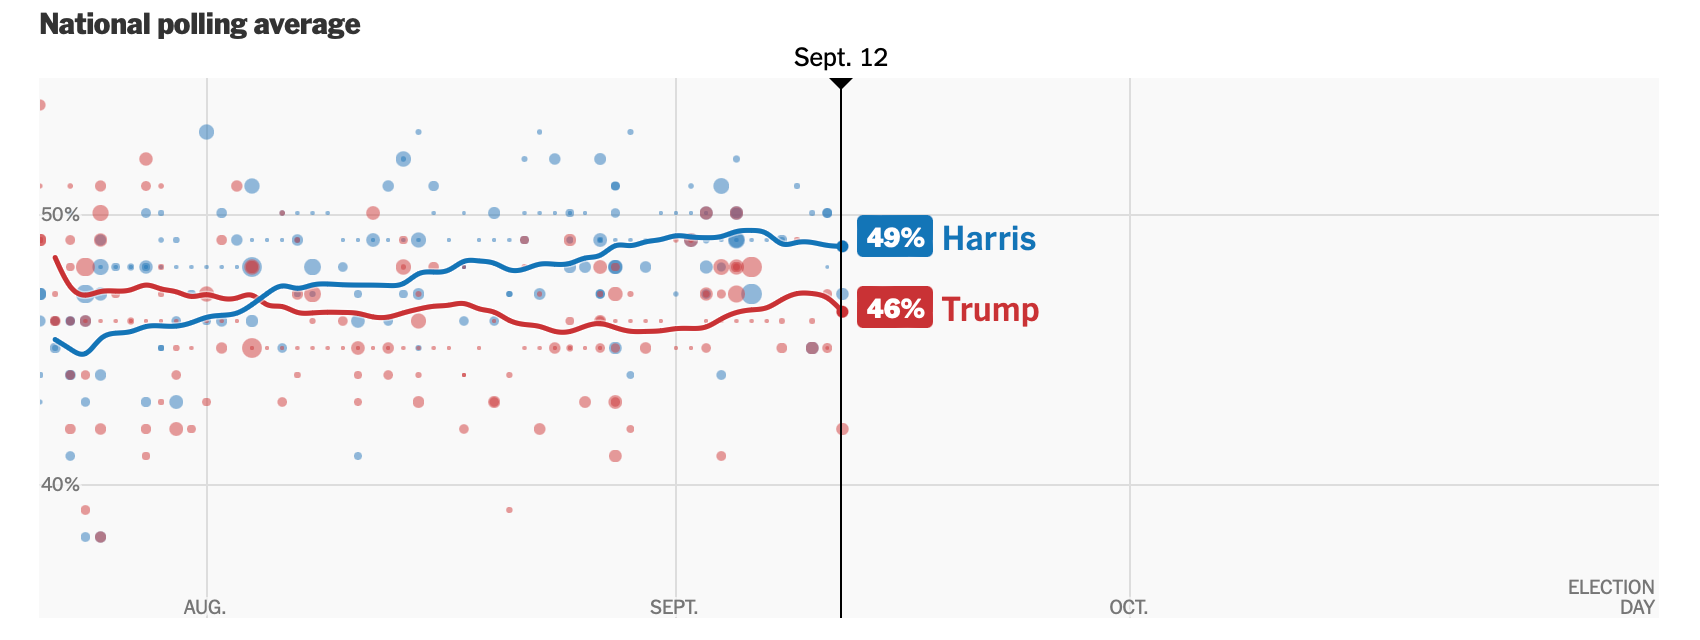
In theory, this gives polling the edge over prediction markets. As with the markets, almost anything can be polled (for instance, a flash poll conducted by CNN on Tuesday showed that 63% of viewers believed that Harris delivered a better debate performance than Trump). My focus here will continue to be on presidential elections, because that's the kind that many of us (including me) are most worried about right now.
Polling became "statisfied", or transformed by modern statistical procedures, in the early 20th century. This is often referred to as the rise of "scientific polling". I want to share with you a famous story about what drove the transformation, as it helps illustrate why the pollsters fared so badly in the 2016 and 2020 elections – and why they're proceeding especially cautiously this year.
The Literary Digest fiasco
In 1936, The Literary Digest, famous for having correctly predicted the outcome of every presidential election since 1916, announced that Alf Landon would beat Franklin D. Roosevelt by a landslide. It was a landslide all right, but one that favored FDR.
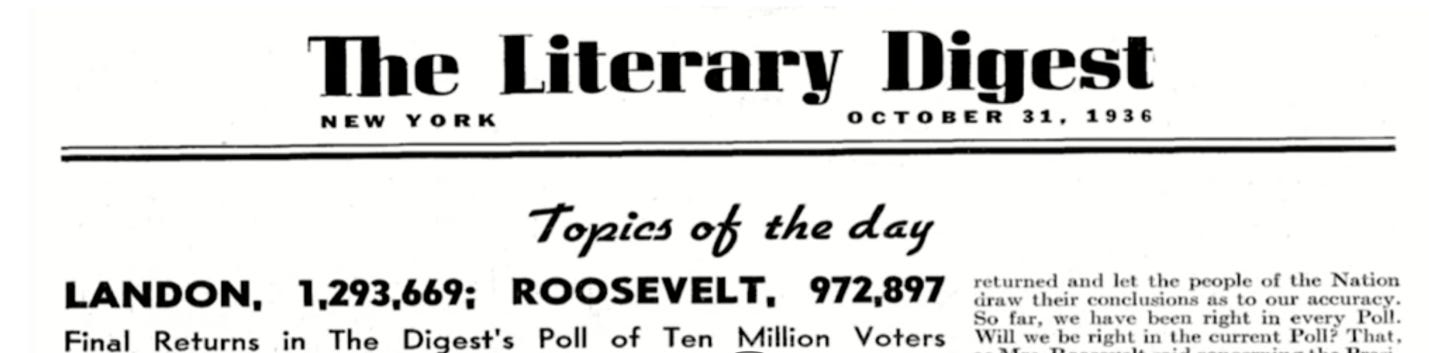
2.4 million voters responded to the Digest's poll. A relative newcomer to the business, George Gallup, polled only 50,000 people and announced that FDR would win instead. How could The Digest have been so wrong, given a sample size roughly 50 times larger than Gallup's? Experts have batted around two explanations:
(a) Sampling bias.
The Digest mainly sampled from phone books and auto registration lists. As a result, most of their respondents were folks who were rich enough to afford telephones and cars during the Great Depression. This is a biased sample, because affluent people at the time favored Landon over Roosevelt.
(b) Nonresponse bias.
The Digest actually sent out 10 million invitations to their poll. The roughly 7.6 million people who didn't respond were more likely to include Roosevelt voters.
Fast forward 80 years. In 2016, most pollsters predicted correctly that Hillary Clinton would win the popular vote, but they were wrong about key states that she ended up losing, and thus they mistakenly predicted an electoral college win. Pollsters got a lot of bad press for the mistake. In 2020, they overpredicted the margin of victory for Joe Biden, and when we look at vote totals for each candidate, the polls were even less accurate in 2020 than in 2016.
Here too, as for 1936, sampling and nonresponse bias figure into the debates about what went wrong.
Sampling bias in 2016 is obvious now: Most of the pre-election polls didn't take into account education levels. Trump beat Clinton by a margin of 72% to 23% among white male non-college educated voters, for instance. If the pollsters had known how many non-college educated people they'd sampled, they could've either adjusted their sampling to get representative proportions of this group, or weighted the responses of those they did sample appropriately.
As for nonresponse bias, there's clear evidence now that Republicans are less likely to participate in political polls, owing to greater mistrust of polls as well as the media organizations that conduct them. (This has been demonstrated among Republicans generally and also at the fringes of the party – e.g., those who buy into QAnon views.)
Partisan nonresponse bias is viewed as a contributor to the 2016 surprise and one of the main reasons most polls and forecasts overestimated the magnitude of Biden's victory in 2020. Forecasters adjust for it now in their models. Live and learn…
Contemporary polling
How did Gallup get it right in 1936, and why was his success influential? In a word, representativeness. Although his methods were crude by contemporary standards, he attempted to glean a representative sample of voters, and his efforts paid off.
Since Gallup's time, polling has become much more statistically sophisticated, though as we can see from 2016, 2020, and other elections, that it remains fallible. In addition, misconceptions around polling are fairly common among voters. Here are two:
1. You can trust the poll in front of you.
Placing too much trust in individual polls is risky, given the many sources of error (sampling bias, nonresponse bias, leading questions, respondents who are afraid to admit they won't vote, etc.) The best that can be said about polls is that the closer we get to an election, the more accurate they tend to be. And, the aggregated results of reliable polls tend to be more accurate than individual polls.
Reliable, nonpartisan polls include The New York Times/Siena College, ABC News/The Washington Post, and YouGov, among others. Forecasters also routinely rate individual polling firms according to their track record sand transparency (see here for an example).
2. Margin of error tells you how wrong the poll could be.
People often assume that if a poll shows, for instance, that Harris is projected to win 52% of the popular vote, and the margin of error is +/– 3%, then the expectation is that she'll win somewhere between 49% and 55% of the vote.
Statistically, this is wrong for several reasons. Non-mathematically speaking, margin of error is an estimate of the range of error that would occur most of the time if the polling methods were essentially sound. It doesn't take into account sampling bias, confusing questions, dishonest respondents, etc. In the previous example, all that's truly being said is that if it's a methodologically sound poll, somewhere between 49% and 55% of the vote will "probably" go to Harris. (Email me if you'd like more details. I've written a plain English overview of margin of error for my book that's too long for this already lengthy newsletter.)
3. Forecasting models
Forecasters rely on all sorts of data to generate predictions about elections. The data they use includes polls, markets, and "fundamentals" such as economic factors and historical trends known to influence election outcomes.
Perhaps the simplest example of a fundamental is incumbency. In the U.S., nearly 70% of incumbents have won re-election to the presidency, and so this factor is routinely woven into forecasting models. So are a lot of assumptions about politics and psychology. For example, is there an incumbent in the current race? Psychologically, it could be Trump, because he's been president, or it could be Harris, because she's currently in the White House, or neither one could be viewed that way. Different forecasters are treating the incumbency fundamental in different ways.
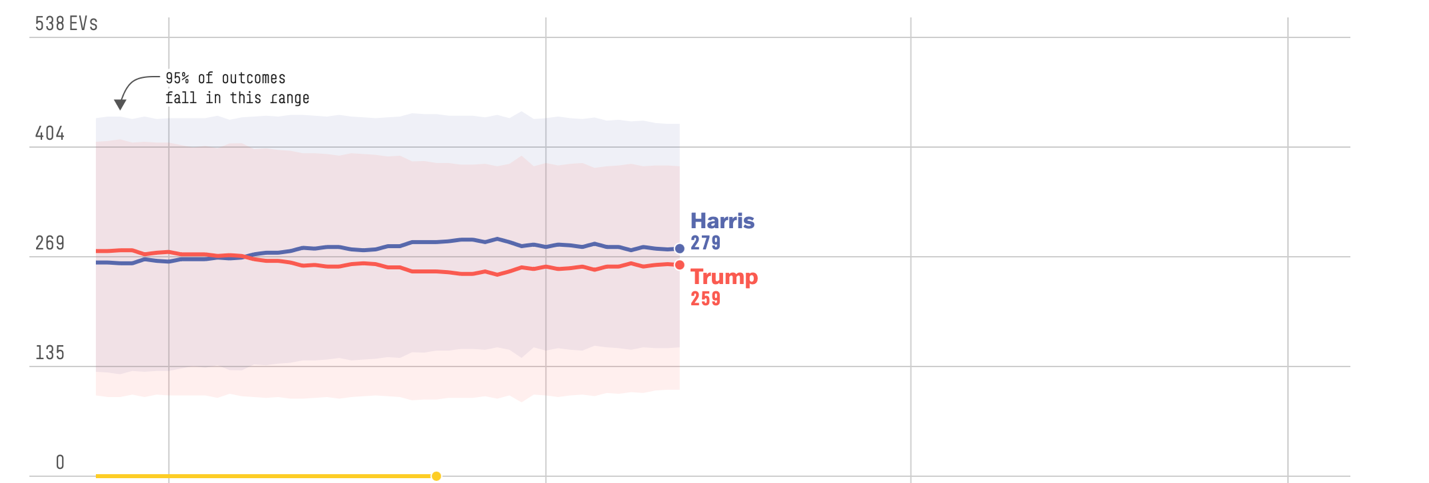
You'll notice I'm not delving into the details of specific forecasting models. Some of them are proprietary, and all of the good ones go very, very deeply into the weeds. (If you want to get weedy, one of my favorites is the 538 model, explained at length in fairly plain English here.)
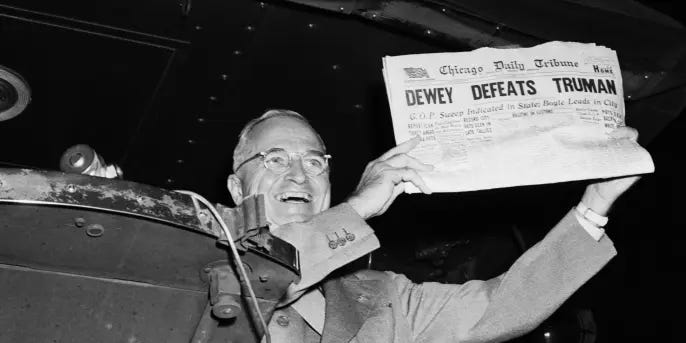
In theory, forecasting is the most accurate approach to predicting elections, because the forecaster can build on the strengths of polls, prediction markets, fundamentals, and other considerations. What's cool about forecasting is that the models are dynamic and can be updated daily based on new information. This flexibility is important, because accuracy for any method tends to increase as the election grows nearer. (Back in 1948, why did an early edition of the Chicago Daily Tribune announce, incorrectly, that Dewey had defeated Truman the night before? Part of the reason was overconfidence in the September and October polls that strongly favored Dewey; we know now that voter preferences can emerge or shift very late in the game.)
Although forecasting is ideal owing to its inclusiveness, in practice it's not consistently more accurate than, say, an average of reliable polls on the eve of an election. This is partly because the forecasters have to make a ton of assumptions about what factors to include and how to weight them. Prominent ones like Nate Silver sometimes perform markedly worse than the pollsters when the data they combine with polling results throws their models off.
A key misconception about forecasting is that there are gurus – folks like Nate Silver who are substantially better than everyone else. The data on that are equivocal at best.
A dash of snake oil
This brings me to a video essay in the New York Times, aired one week ago, on Dr. Allan Lichtman (see below), a colorful history professor at American University who has correctly forecast the winner of almost every U.S. presidential election since 1984.

Before you say "wow!", consider this: There have been 10 elections since 1984. Given that incumbents usually win re-election, simply choosing the incumbent would be the correct choice in 1984 (Reagan), 1996 (Clinton), 2004 (Bush), and 2012 (Obama). At the same time, you'd surely override the incumbency principle in 1992 once Clinton attained a commanding 15% lead over George H.W. Bush. Only a few of those elections looked like genuine toss-ups by late October.
My point is that it's not particularly remarkable for someone to have accurately predicted the winners of most of the last 10 presidential elections. The New York Times failed to mention this.
Dr. Lichtman is most famous for predicting a Trump win in 2016, in contrast to what many forecasters and polls had been saying. Sadly, it turns out that this particular historian is guilty of rewriting history himself. He predicted Gore in 2000 and Trump in 2016. After Gore lost the electoral college vote in 2000, Lichtman claimed that he'd been talking about the popular vote (which Gore did win). After Trump lost the popular vote in 2016, Lichtman claimed he'd been talking about the electoral college vote (which Trump did win). The New York Times neglected to comment on signs of fudging, saying only that Lichtman correctly predicted "almost" every presidential election since 1984 but not saying exactly how many of out the 10 he nailed.
I'm sure Lichtman is brilliant. He's also a charismatic self-promoter. I would call him a bit of a snake-oil salesman, because (a) his accuracy is only moderately impressive, (b) he has misrepresented his accuracy, and (c) his forecasting model isn't very credible in the first place.
The problem with the model is that it looks at 13 "keys", or indicators of success, many of which are subjective (social unrest, charisma, etc.) and all of which operate at the national level.
Better forecasting models consider how state-level performance creates different paths to electoral college success. For instance, in the current presidential race, it's clear for the moment which way the vote will swing in 43 states. The election will almost surely be determined by performance in seven states where the race is exceedingly close (Arizona, Georgia, Michigan, Nevada, North Carolina, Pennsylvania, and Wisconsin). Forecasting models from organizations such as fivethirtyeight.com, and from individuals such as Nate Silver (who founded 538 before moving on) place much emphasis on indicators of performance in these battleground states.
Silver, by the way, is among the purported gurus who've been accused of fudging. I find him more transparent than Lichtman – and more successful, given the number and variety of elections he has predicted. Still, he's no guru; his performance after dramatic successes in 2008 and 2012 has declined. (George Gallup had mixed success too. He too predicted a Dewey win in 1948, and he wasn't actually the only expert to make the right call in 1936.)
Which method is most accurate?
I've discussed prediction markets, polls, and forecasting. Whether you judge accuracy in terms of predicting winners, or vote shares, or something else, I don't think any one of these methods has proven consistently better than the rest. This is partly because they tend to draw on each other. As long as unreliable sources are weeded out, their predictions tend to converge as elections approach. Meanwhile, people are complicated. We may never know for sure how they'll vote until the election is over.
Science, gossip, or snake oil?
Predicting elections is scientific, in the sense that scientific methods are used to gather and analyze data. But it's inherently weak science.
When one candidate already has a big lead across polls, using one or more of the three methods to pick the winner is like using a scale to determine that dogs weigh more than mice. Yes, you're being scientific, but the scientific rigor is overkill. This may be more accurate than getting people drunk and talking up one of the candidates, but not necessarily by much.
To properly evaluate a prediction method, we need to do one or both of the following: Check how well it performs in close races, or check how well it predicts something like vote shares.
The problem with checking performance in close races is that there aren't many to compare. We run into a problem statisticians call overfitting, which is to say that a prediction method that works well with prior races won't generalize to new ones, because the circumstances have changed. (Here's a crude analogy for how overfitting works: Look at the following series of numbers and guess what comes next: 2, 3, 4, 5, 6, 7…. You probably guessed that 8 is next. But imagine that what I was actually doing was listing pairs of adjacent numbers that start with the same letter. If that were the case, the series would go like this: 2, 3, 4, 5, 6, 7, 12, 13, 14, 15…). Your guess perfectly fit the series I provided, but it would cause you to incorrectly predict an 8.)
Pollsters and forecasters sometimes crow about the accuracy of their predictions, but this gets a little snake oil-ish at times, because accuracy is subjective. If the late-October polls say that Harris will gain 53.6% of the popular vote, what would be an accurate projection? 53.4% Sure. 52.5%? Ok. How about 50.2%? There's no clear cutoff for accuracy. (You could use margin of error, but that's not as helpful as it sounds, because it's a theoretical estimate.)
In the end, predicting elections is a scientific way of organizing gossip – gossip from prediction markets and polls and forecasters (who rely on markets and polls and fundamentals and punditry and their own gut). A bit of snake oil seeps into this process wherever interest in the outcomes of elections can be monetized. Keep all this in mind, please, before getting too stressed out about any specific poll or forecast.
Final suggestions
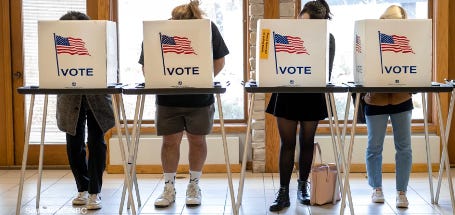
Register to vote if you haven't already (details here), and then take the time to vote (details here). Encourage other people to do the same.
I've focused on presidential elections, but the rest merit participation too. Don't skip the process just because your candidate seems like a sure thing or an underdog. Whether you're looking at markets, polls, or forecasts, they've all been wrong at times – and they're not always wrong in the same way in the same election.
Thanks for reading!