

Big Tobacco, Big Oil, Manufactured Uncertainty
Big Tobacco, Big Oil, Manufactured Uncertainty

Two studies that made the news last week reminded me of how statistics help expose corporate deceptiveness about product safety.
1. On January 11, the American Cancer Society released its annual report, showing, among other things, that rates of lung cancer are continuing to decline.
The report also showed that Americans are continuing to smoke less, ultimately because we recognize that it's a dangerous practice. For decades tobacco companies pleaded uncertainty about whether smoking causes cancer, but internal documents show that they knew better, and in 2006 the U.S. v Philip Morris ruling forced them to publicly acknowledge the deception. Statistics were essential to demonstrating a causal link between smoking and cancer, a link so clear that uncertainty about the data became unjustifiable.
2. On January 13, Science published a study showing that since the late 1970s, Exxon scientists predicted global warming trends at least as accurately as independent scientists did, though the company's public statements contradicted what their data showed.
Global warming continues to occur and is driven by greenhouse gas emissions, particularly carbon dioxide. For decades the oil and gas industry pleaded uncertainty as to whether global warming is real, eventually acknowledging it while questioning whether greenhouse gas emissions are to blame. Evidence shows that they knew better, and, following a 2015 InsideClimate News exposé, Exxon's deceptive public statements have garnered lawsuits and congressional scrutiny.
In each case, Big Tobacco and Big Oil industry leaders adopted a strategy of manufactured skepticism, arguing that there's not enough data to draw conclusions, or that the data are inconsistent, or questionable – in a word, uncertain. (In a now-classic 2010 book, Naomi Oreskes, a co-author of the Science study, uses the phrase "merchants of doubt" for the small number of scientists who supported these industry leaders). However, in spite of the millions of dollars Big Tobacco and Big Oil poured into manufacturing skepticism, they were unable in the end to discredit evidence of damage caused by their products. What made that evidence so persuasive was its consistency. When studies using different methods and statistical models yield similar findings, scientists accept, at least provisionally, that something has been learned. In this way, statistics helped undermine the false skepticism of Big Tobacco and Big Oil.
In this newsletter I'll describe some of the ways statistics helped accomplish this feat. In the case of the tobacco industry, I'll be talking about older studies, while for Exxon, the new study merits a closer look, in part because it illustrates the power of statistics, and in part because you'll be hearing about it again, as it strengthens the legal argument that ExxonMobil and other oil and gas corporations have intentionally deceived the public about climate change.
Statistics vs. Big Tobacco: A quick look
As I mentioned, the American Cancer Society report shows diminishing rates of lung cancer, a trend that reflects a decline in the percentage of adults in the U.S. who smoke, from a peak of roughly 45% in 1954 to around 13% now. Meanwhile, Gallup data show that the percentage of Americans who believe that smoking causes lung cancer rose from about 40% in 1954 to over 90% by 1990. (It's hard to find anything health-related that so many of us agree about!)
Briefly, here's what's behind these changes in public behavior and beliefs. From the 1920s through the 1940s, evidence accumulated that smoking causes lung cancer, but research conducted in the 1950s, which I'll discuss in a moment, marked a turning point. The new data linked smoking to cancer strongly enough to cause public alarm, diminish cigarette sales, and, in 1953, drive tobacco industry leaders to hire a public relations firm and begin a fifty-year campaign of attacking the evidence. The 2006 United States v Philip Morris ruling, in which nine major tobacco companies were found guilty of deceiving Americans about the health effects of smoking, established that by 1953-1954, tobacco company executives knew about the studies establishing smoking as a cause of cancer. Executives not only knew about these studies, but recognized the findings as credible – and, in some cases, suppressed them.
What distinguishes those early studies is their increasingly compelling demonstrations of causality in the face of manufactured skepticism. The tobacco industry and its defenders acknowledged a relationship between smoking and cancer, but they persistently explained away that relationship as merely correlational. For instance, they knew that lung cancer was almost non-existent prior to the 20th century and began to increase only when smoking did, but they argued that lung cancer was caused by other changes occurring at the time, such as an increase in automobile exhaust and industrial pollutants. To their chagrin, a wave of retrospective studies, published in 1950, showed that men with lung cancer were much more likely to have been smokers than those of similar demographic background who don't have the disease. For example, in one of those studies, Ernest Wynder and Evarts Graham interviewed 2,016 hospital patients who either had or did not have lung cancer. 96.5% of the lung cancer patients had been moderate to heavy smokers (more than 10 cigarettes per day for at least 20 years), as compared to only 2% of non-smokers or minimal smokers (1 to 4 cigarettes per day for at least 20 years). Wynder and Graham also found links between the amount smoked and the likelihood of developing cancer.
This looks like pretty clear evidence of causality, but, as tobacco industry scientists pointed out, retrospective "case control" methodology is inherently limited. Smokers may have overestimated the amount they smoked, while the non-smokers and/or minimal smokers might've forgotten or underestimated their smoking. It's also possible that the "cases" (those with lung cancer) differed in some important way from the controls (those with no cancer) – for example, the cases might've also been exposed to more industrial pollutants at work. And, there's Ronald Fisher. I'll tell this story at greater length another time, but Fisher, one of the most important statisticians in history, floated the possibility of a gene that causes people to like smoking and, independently, to develop lung cancer. He also speculated that researchers got the direction of causality wrong. Maybe, he argued, people with lung cancer are more likely to smoke as a way of coping with the disease. Although these possibilities were quickly discredited, Fisher's prominence, and the fact that he was funded by the tobacco industry, makes them enduringly repugnant.
Fortunately, the researchers who'd been studying links between smoking and cancer were persistent too. By the end of the 1950s, three large prospective studies had been completed. "Prospective" means, in this case, that all participants were healthy at the outset of the studies and researchers waited to see who developed lung cancer. Naturally, these were large studies that included some people who already smoked. (A prospective study that begins with 12-year-old nonsmokers would require decades in order for some participants to take up smoking and, later, show health effects.) For example, E. Cuyler Hammond and Daniel Horn tracked 187,783 men for 44 months. Since internet surveys were impossible back then, Hammond and Horn recruited more than 20,000 American Cancer Society volunteers to help them collect interview data and, as needed, confirm cause of death. By the end of the 1950s, Hammond and Horn's data, as well as evidence from prospective studies on a combined total of over a million adults, yielded similar results: Smokers were much more likely to die from lung cancer than non-smokers, and the likelihood of dying from lung cancer was related to the amount smoked.
Although any individual study can be questioned, the consistency of the statistical evidence across studies is what ultimately undermined Big Tobacco's manufactured skepticism. Epidemiological studies such as the ones I've described were conducted in different countries, using different methods, and they were buttressed by evidence from animal research and toxicological analysis. Taken together, the data led to scientific consensus, captured in a landmark Surgeon General's report in 1964, that smoking causes lung cancer and other diseases.
Statistics vs. Big Oil: A quick look
I'll start with some context for the January 13 study, then delve into a few key statistical details.
In 2015, an InsideClimate News report entitled "Exxon: The road not taken" revealed that for roughly four decades, Exxon leaders knew that climate change was occurring, that greenhouse gas emissions were contributing to global warming, and that the mainstream scientific community had reached a consensus about all of this.
However, the company's public reaction to the data was consistently skeptical, analogous to how the tobacco industry responded to evidence that their own product was harmful. That's not a coincidence, of course. Internal documents show that Exxon (and, since 1999, ExxonMobil) intentionally relied on Big Tobacco strategies for casting doubt on climate science, in some cases hiring the same "experts" who had previously questioned links between smoking and cancer. As noted in The Merchants of Doubt, some of these experts were scientists themselves, but none of them had expertise in relevant fields such as oncology or climate science. They were, in effect, shills, who took money from tobacco companies to raise doubts about links between smoking and cancer, and then, some years later, took money from oil and gas companies to raise doubts about global warming and its connection to greenhouse gas emissions.
The fallout from the InsideClimate News report included bad press, numerous lawsuits, and a 2019 congressional hearing, "Examining the oil industry's efforts to suppress the truth about climate change." (Reports from that hearing were made public last month.) However, the battle against manufactured skepticism is more challenging with Big Oil than it was with Big Tobacco. Lung cancer is an objective, individual-level outcome that's rarely missed or misdiagnosed, whereas measures of climate change, such as global warming, are environment-level variables that require much more complex measurement techniques.
The InsideClimate News report shows that Exxon knew about problems such as global warming but deceptively aired doubts about the evidence. (As late as 2013, CEO Rex Tillerson referred to climate models as "not competent.") The Science study published on January 13 of this year is important because it shows precisely what Exxon knew at different points in time. The statistical data in this study constitute a "smoking gun" that's likely to increase ExxonMobil's legal culpability as well as industry-wide accountability.
The focus of the study, conducted by Geoffrey Supran, Stefan Rahmstorf, and Naomi Oreskes, is on ground mean surface temperature (GMST). In an earlier newsletter, I describe how GMST is measured. Briefly, climate scientists estimate GMST by dividing the earth into grids, calculating average temperatures within each grid, then averaging the averages (integrated over time). For example, NASA's Goddard Institute for Space Studies' Surface Temperature Analysis (GISTEMP) divides the earth into grids of 2 degrees latitude and longitude. (In America, that's about 138 miles by 110 miles.) The averages are obtained near the surface from weather stations roughly 5 feet above the ground, or devices on ships, buoys, etc. ranging from less than an inch to over 60 feet below the waterline. In spite of the complexity and messiness of GMST measurement, various models show remarkably high convergence.
For their study, Supran and colleagues examined all reports pertaining to climate change that were created by Exxon/ExxonMobil scientists, or created externally and presented to internal leadership by these scientists. To make things simple, I'll call these reports the "ExxonMobil data." The final sample of ExxonMobil data consisted of 32 documents generated between 1977 and 2002, along with 72 peer-reviewed articles published between 1982 and 2014. Supran and colleagues mainly focused on how well ExxonMobil models predicted actual changes in GMST in subsequent years, and on how well these models performed against those developed by independent scientists.
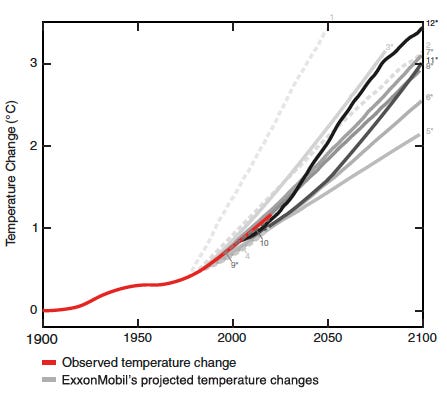
The ExxonMobil data contained 12 different models of global warming. Supran and colleagues rated each model as either consistent or inconsistent with subsequent changes in actual GMST. "Consistency" was determined by looking at the extent to which the model's predictions deviated from what actually happened. (If you're familiar with confidence intervals, I provide more details in the Appendix.) The projections of 10 out of the 12 models were consistent with actual GMST increases. (One predicted greater warming, one predicted less.) In short, the models that Exxon and later ExxonMobil leaders had been familiar with were quite accurate. You can see this in the figure below. The red line represents actual GMSTs measured over time. The gray lines represent ExxonMobil model projections. (The darker the gray, the more recent the model.) The important part of the graph is the place where the red line is tightly squeezed between all the gray ones. This part illustrates that ExxonMobil projections were quite accurate. All the model lines here are trending upward, in most cases with about the same slope as the actual data line. (The one exception, the dotted line on the far left, strongly overestimates the extent of warming that would occur.)
The researchers also evaluated ExxonMobil models by means of "skill scores". Roughly speaking, a skill score tells you how much better a model performs than one that assumes GMST varies randomly and isn't truly increasing. The highest possible skill score would be 100%, meaning that model projections perfectly represent the data. Skill score means for ExxonMobil models were high (72% overall). In fact, the ExxonMobil models performed as well as, and in some cases better than, models that had been published by independent researchers.
In sum, even if Exxon/ExxonMobil leaders chose, for whatever reason, to ignore independent research, the data obtained by their own scientists clearly indicated rising GMSTs, even while the company publicly denied that such changes were occurring. Corporate leaders knew as well as independent scientists – in some cases, with even greater accuracy – that global warming was no fluke, but they continued to play the uncertainty card. This is especially disturbing, because in the end, both the ExxonMobil scientists and the independent ones were saying the same thing. Although some models turned out to perform better than others, they all predict rising temperatures, and, statistics asides, the ExxonMobil scientists, like their counterparts, were not only presenting numbers but also expressing alarm in clear, non-technical terms.
I believe you will hear about Supran et al.'s study again, because it identifies the specific models and statistics that Exxon/ExxonMobil leaders were presented with in different venues at different points in time, statistics that are at odds with the corporations' public statements. I anticipate more lawsuits and, depending on political variables, further political scrutiny.
Conclusion: The perils of manufactured uncertainty
In the end, the heroes of this story include, among others, scientists like Naomi Oreskes who published and/or publicized data on the harmful effects of tobacco and greenhouse gas emissions. Their weapons of choice, as you've seen, include statistical methods and models.
We can always nitpick about the merits of any one study and its findings. Uncertainty is inherent to empirical research, and what we learn from each study remains open to revision. But when scientists obtain the same results, again and again, across studies that rely on different methodologies, we trust those results, just as we trust a product like ibuprofen to have the capacity for relieving pain even if it hasn't done so 100% of the time. What Big Tobacco and Big Oil did was to go beyond what might be called "natural uncertainty" – the caution scientists maintain about the results of individual studies – and engage in a process of manufactured uncertainty. Industry leaders and their shills claimed that evidence of their product's harmfulness could be doubted, long after the consistency of the findings proved them wrong.
Thanks for reading!
Appendix: Confidence intervals and determination of model consistency
If you're familiar with confidence intervals, here's an explanation of how Supran and colleagues used them, as well as some remarks on whether their use was appropriate.
One way Supran and colleagues evaluated the performance of each model was to calculate a 95% confidence interval for the difference between each model's projections of GMST and the actual, observed values. Each time the 95% confidence interval contained a value of zero, the researchers judged that model to be consistent with the actual data.
The researchers' treatment of confidence intervals is consistent with mainstream practice in social science but might displease a statisitician, because a confidence interval does not provide information about specific true values but rather about the chances that you could, in the future, obtain information about true values.
For example, suppose that researchers find an actual rise in GMST of 0.3 degrees across some time period, and they calculate a 95% confidence interval for this value as 0.2 to 0.4 degrees. This doesn't mean there's a 95% chance that the actual value falls between 0.2 and 0.4 degrees. Nor does it mean that if the measurement were repeated, the GMSTs obtained would fall between 0.2 and 0.4 degrees 95% of the time. These two misconceptions are widespread among social scientists. A 95% confidence interval of 0.2 to 0.4 degrees is merely an estimate of the true GMST. It indicates that if you were to repeat the measurement many times, 95% of the intervals you calculated would contain the true GMST. But you wouldn't necessarily get the same interval each time. You might get 0.1 to 0.3 degrees on one occasion, 0.5 to 0.8 degrees on another occasion, and so on.
In short, what a confidence interval gives you "confidence" about is your measurement procedure, not about the specific values it yields. This is disappointing news to social scientists – and probably one reason misconceptions are prevalent – because once we've obtained a specific interval, like 0.2 to 0.4 degrees, we naturally want to focus on those values and say (incorrectly) there's a 95% chance that the true GMST falls within that range.
Of course the true GMST is unknown, and thus we have no way of knowing how probable it is that we've captured the true value.
In Supran and colleagues' study, model projections were judged consistent with the actual data if the 95% confidence interval for the differences between them contained a value of zero. This seems like an attempt to straddle the difference between the true definition of confidence intervals and the way they're often misinterpreted. Is it an acceptable approach?
In this study, calculating differences between model projections and observed data constitute the "measurement", and the researchers' confidence intervals simply tell us that if this measurement were repeated many times, the 95% confidence intervals that get calculated would contain the true extent of difference between model and observed data 95% of the time. However, it's unclear how many of those confidence intervals would contain a value of zero. So, from a purist's viewpoint, there's a problem. Still, I think this analytic approach is credible. What saves it, crudely speaking, is other statistical evidence. The actual extent of difference between model projections and observed data tends to be small, and, in 10 out of 12 cases, the models the researchers evaluated met the criterion for consistency. The models themselves constitute a sample, in other words, and the consistent pattern gives us more confidence in the confidence interval data.