Dating a Shark


In spite of what my title might imply, this newsletter is not about a romantic relationship I once had with a corporate lawyer.
I will be talking instead about one way to determine the age of a shark. I'll briefly mention some new studies in marine biology. But the main point of the newsletter is to discuss how statistics help us cope with an inherently uncertain world.
Dealing with uncertainty
What can you do about uncertainty? Broadly, you can ignore it, reflect on it, or manage it.
1. Ignoring uncertainty.
Every morning, we wake up with more expectations than we could possibly describe. Running water when we turn on the shower. A stable internet connection. A coffee grinder that works. None of these things is guaranteed. But it's not possible to stop and reflect on all the uncertainties – if you did, you couldn't survive.
Although we have to ignore some uncertainties in order to function, doing so is always risky. The risks range from the utterly trivial (if the coffee grinder breaks, I can drink tea), to the deeply consequential.
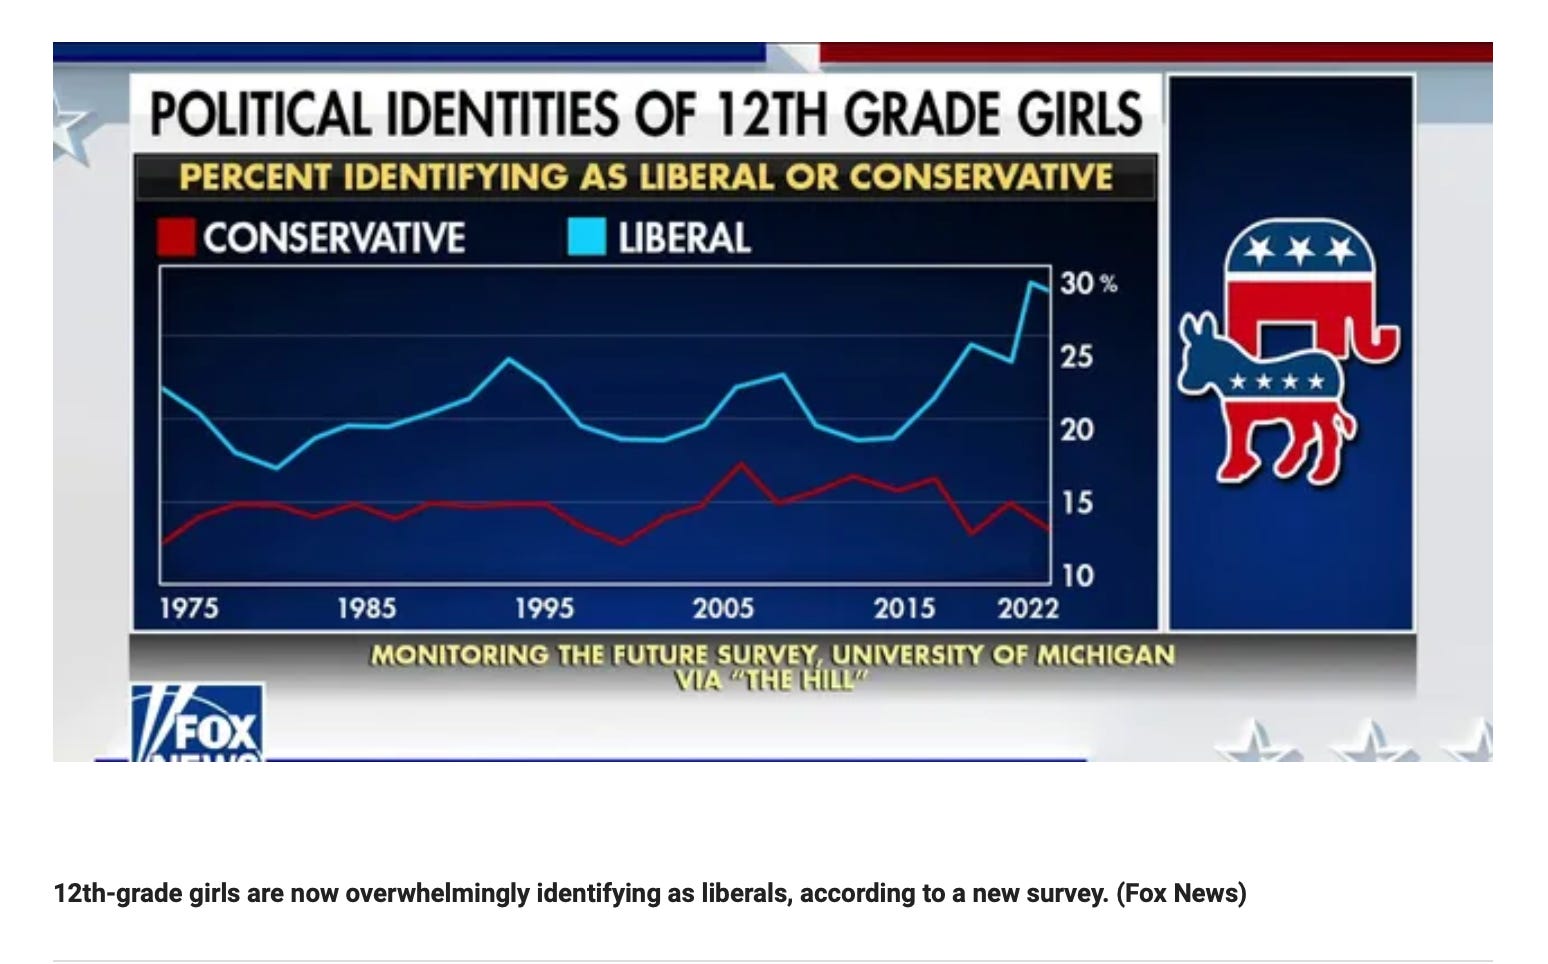
For instance, consider this screen shot from an article published on the Fox News home page yesterday:
Fox often reminds me of that 3-year-old with chocolate-stained face, hands, and shirt who says no, I didn't eat the chocolate. Neither Fox nor the child seem to realize how untruthful they appear to be.
For one thing, the data in this graph don't support the contention that 12th-grade girls "are now overwhelmingly identifying as liberals". For 2022, the figure is just under 30%. That's not an overwhelming percentage (unless you're psychologically "overwhelmed" that anyone would profess to be a liberal).
More importantly, when you add the percentages of liberals and conservatives for any year, including 2022, the sum is less than 50%. In other words, we have no information about more than half of 12th grade girls surveyed.
As it turns out, the majority of those girls either identified as moderate or undecided. A lot more girls chose not to participate in the survey in the first place. In short, there's much more uncertainty than certainty here.
All you can conclude from the graph is that for the roughly 40% of 12-grade girls who chose a position, about twice as many called themselves liberal as opposed to conservative. Since there's no evidence this is a representative sample, the data permits no generalizations about 12th-grade girls. At most it hints that girls at this age are more likely to be liberal than conservative. (Even if that were the case, we can't know whether the extent of difference is large or small, whether a considerable number of the girls will change their views by the end of the year, or whether we should even be describing their political views by means of a simple liberal-conservative dichotomy.)
Ignoring uncertainty is problematic because it leads to overly simplistic, extremist views, such as those that routinely populate Fox News (and other sources, not all of which reflect conservative biases).
2. Reflecting on uncertainty.
Reflecting on uncertainty can be helpful – it allows us to discount the way Fox spun the 12th grade survey data, for example – if we're selective about when and how we reflect. Winnie the Pooh and Piglet are adorable, but we wouldn't want to reason the way they do:
’Supposing a tree fell down, Pooh, when we were underneath it?’
‘Supposing it didn’t,’ said Pooh after careful thought.
Piglet was comforted by this.
What we typically do – and should do – is to ignore the prospect of a tree falling on us, given the rarity of the phenomenon, unless we have cause to worry (e.g., a strong wind and a creaking sound nearby...)
My newsletters often contain reflections on uncertainty. Daniel Parris, who writes an intriguing newsletter called Stat Significant, asked me in a recent interview how I feel about seeking certitude. Part of my response was that I often recommend less of it. For instance, in nutrition studies, assertions about links between consumption of a particular food and specific health outcomes should usually be taken as no more than hints, given the difficulty of measuring how much of any food people eat over long periods of time, while simultaneously controlling for other influences on their health.
Uncertainty is uncomfortable, but so is being deluded. I would rather think that hot dogs are "somewhat" unhealthy, and live with the discomfort of not knowing exactly how many I can safely eat, than to proclaim, overconfidently, on the basis of sophisticated statistical techniques (applied to weak data), that each hot dog a person eats reduces their life span by 35.4 minutes on average. (I discuss the "hot dog study" and the false precision of its 35.4 minute estimate here.)
3. Managing uncertainty.
Through reflection we might realize that we know less than we think about the political views of 12th grade girls, or about the exact health impacts, if any, of hot dog consumption. But sometimes we need more than reflection. We need to actually reduce the uncertainty we're experiencing. This is where statistics can play a role.
Statistics consist of tools for managing uncertainty. When we say there's a 5% chance of rain tomorrow, or that some vaccine is 90% effective, or that Medicare payments are expected to increase by over 3% on average next year, we're describing our uncertainty numerically, in ways that allow us to make decisions. We don't bring an umbrella if a 5% chance of rain is forecast, but we do if it's 95%.
Prior to the 20th century, people didn't talk about the chances of precipitation, the effectiveness of medicines (as currently calculated), or expectations about future averages. Only when statistical methods became deeply integral to science did scientists' statistically-based descriptions of things become the way the rest of us describe them too.
We don't necessarily understand these descriptions. When a forecaster tells us there's a 5% chance of rain tomorrow, we repeat that statistic, but we may not realize that this 5% equals the forecaster's confidence that it will rain somewhere in a particular area, multiplied by the percent of that area in which rain is expected. A 5% chance of rain forecast for Dallas tomorrow could mean 100% certainty that 5% of the city will experience rain, or 50% certainty that 10% of the city will experience rain, or something else. (Sadly, the actual chances of rain in Dallas tomorrow are 0%, and the expected high is 105.)
That's alright, you might think. Weather is complicated, and it changes from day to day. But even the more enduring "facts" that scientists teach us often turn out to represent their best efforts at managing uncertainty. We may learn and repeat those facts without appreciating that statistics had to be used in order to say anything at all.
For instance, last week (being Shark Week), I read that the longest-living verterbrates are Greenland sharks, one of which lived roughly 400 years. I also read that the exact estimated age was 392 years. I repeated this "fact" (as did CNN and other organizations) without realizing that the shark's actual age was an estimate that included an enormous margin of error. I only realized this after looking at the method used to estimate its age.
Radiocarbon dating
Radiocarbon dating is one of those things I've read about in the news and in museums that I've always assumed to be just one more type of accurate, objective measurement. As you've probably guessed, I was wrong.
Radiocarbon dating (aka carbon dating) is a method of estimating the age of organic material, including prehistoric plants, animals, and people, as well as stuff that that living things leave behind (seeds, feathers, poop, etc.) and even artifacts (e.g., the Dead Sea Scrolls, which were written mainly on animal skins). In most cases, this method can be fairly accurate for material up to about 50 to 60 thousand years old.
Since carbon dating was first developed by Willard Libby in the 1940s, statistical procedures have played a critical role in how it operates. Improvements in equipment and dating techniques have gone hand in hand with updates to the kinds of statistics that are used. (Even now, before I say more, you should suspect that radiocarbon dating is a way of managing uncertainty. Statistical procedures aren't needed when the facts are fully known.)
Like other elements, carbon atoms come in different forms, or isotopes, according to the number of neutrons they contain. Carbon dating methods examine C-14, a radioactive isotope of carbon. C-14, created in the stratosphere, makes its way into plants via photosynthesis and is thus present in all all living things.
Carbon dating methods rely on a mix of certain as well as uncertain information. Here are three things that scientists are absolutely certain of:
1. The amount of C-14 in a living organism is exactly the same as the amount in its immediate environment (the air, water, and/or soil around it).
2. Once an organism dies, the C-14 in it decays at a predictable rate. For example, after 5,730 years, an organism will contain half the C-14 it contained when it died. (This will be the case regardless of environmental conditions. C-14 in whale bones at the bottom of the ocean decays at the same rate as C-14 in desert plants.)
3. If a sample of material from a dead organism is properly cleaned, something called accelerator mass spectrometry (AMS) can determine very accurately the proportion of C-14 in the sample.
In theory, we have everything we need here to date organic material with certainty. Just clean up that scrap of fossilized Giant Sloth poop, switch on your accelerator mass spectrometer, measure the proportion of C-14 in the poop, and, voila, you'll discover that it's, say, 17,900 years old.
Unfortunately, uncertainty creeps in from many sources. The amount of C-14 in the environment varies over time and from area to area (sloths and whales, for instance, would be exposed to different amounts during any historical period). Animals may move between environments and consume plants that vary in the proportion of C-14 they contain. Samples such as fossils are typically contaminated by materials that surround them wherever they're found, as well as by newer carbon, human handling, etc. Humans have broader influences too. The industrial revolution diluted the amount of C-14 in the atmosphere (since fossil fuels are so old they contain almost no C-14). More recently, atomic detonations during the 1940s through 1960s increased the amount of environmental C-14. In short, just measuring C-14 proportions in some organic material won't give you an accurate read on the age of that material.
Statistics help manage these uncertainties in many ways, most essentially through the creation of calibration curves.
Calibration curves
Calibration curves link radiocarbon data to actual calendar years. These curves ultimately yield a range of possible dates for an organism that existed in a particular place and time.
You're probably familiar with ranges like these from polling data ("the margin of error for this poll is +/- 3 points"). What that Giant Sloth poop is judged to be 17,900 years old, what the scientist would actually say that it appears to be about 17,900 years old, plus or minus 800 years. With some further digging, you'd find that the scientist believes there's a 95% chance that the poop is somewhere between 17,100 and 18,700 years old. (In another newsletter I'll say more about what this means and whether it's a suitable interpretation, statistically speaking.)
Calibration curves are generated by synthesizing many different kinds of data, including C-14 data obtained from tree rings, corals, and varves (sedimentary layers in lakes). If you have some background in statistics, I describe one of these curves in the Appendix.
As with all statistical procedures, calibration curves are only as good as the methods use to gather the data. As Christopher Ramsey, an expert at the University of Oxford notes, "the statistical methods do not overcome any methodological shortcomings in the radiocarbon method itself."
Ramsey and others have observed that owing to commercial as well as academic "publish or perish" pressures, users of carbon dating sometimes rely too heavily on the newest equipment and latest statistical procedures, rather than on a careful synthesis of the data. His concerns are strikingly similar to those that many (including me) have raised about research in social science, education, health, etc., where fancy statistics yield precise but possibly inaccurate results, owing to flawed approaches to measurement. In any case, much can be learned from carbon dating.
Greenland sharks etc.
During "Shark Week", I learned that the oldest vertebrate on record was a Greenland shark, determined by carbon dating to have lived to about 392 years. The margin of error was rather large (+/- 192 years), so that 392-year figure is not a fact but rather a crude estimate.
All the same, if you want to decide which vertebrates live longest, Greenland sharks win the prize, because (a) another specimen was nearly as old, with a smaller margin of error (332 years +/- 75 years), and (b) the next longest-living vertebrate, the bowhead whale, is far behind, with the oldest specimen clocking in at 211 years.
There's no overlap in the 95% confidence intervals for the 332-year-old shark and that bowhead whale. Scientists have taken this to mean that even if the bowhead whale longevity is underestimated and the Greenland shark longevity is overestimated, the shark almost certainly lived longer.
Much more could be said about statistics and marine biology. A study of Greenland whales published last week used statistical procedures to estimate (to some degree of confidence, but not total certainty) when whale diving patterns return to normal after they're tagged. A study that made the front page of the New York Times this week describing a 505 million-year-old creature used statistics to determine (again, to some degree of confidence, but not total certainty) that it was related to comb jellies rather than jellyfish.
These are pretty esoteric findings, mainly of interest to marine scientists. But they provide a good illustration of the idea that "scientific facts" are often "scientific best guesses", based in part on statistics that were used to reduce uncertainty.
Closing thoughts
Is it scary to treat facts as "best guesses"? I find it a little unsettling, but encouraging too.
Consider James Ussher. In 1650, Ussher calculated that God created the universe in 4004 B.C.
Ussher was no crank. He was a highly respected Archbishop who used the reputable scientific work of his day, in conjunction with the Bible, to arrive at this influential estimate. The most prominent scientists, including Newton and Kepler, disagreed but still considered the universe less than 6,000 years old.
The fact that these scholars were wrong, by billions of years, tells us that their best guesses were supplanted over time by better guesses. Ideally, this is how science works. Since 1929, the estimated age of the universe has continued to increase from 2 billion years to about 13.7 billion, with a margin of error in the millions of years. The fact that the universe is probably not exactly 13.7 billion years old, to the day, isn't worrisome. It's the best guess we have.
What's worrisome is that some people still cling to the "young earth" perspective and otherwise turn their back on science. According to one website, there are "six evidences (sic) of a young earth". None of them make sense. For instance, Evidence 1 is the fact that carbon dating doesn't reveal anything over 60,000 years old. Of course it doesn't. Individual C-14 atoms don't exist longer than that. But new ones have been constantly created in the stratosphere since the universe was formed. Meanwhile, literally dozens of other "evidences" tell us that the earth, like the rest of the universe, is billions of years old. Potassium-argon dating, for instance, uses statistical methods in a way similar to carbon dating, but works best with timespans of millions and even billions of years.
I'm not a physicist. I can't claim to understand these dating methods very deeply. But I think the chances that all the physicists in the world are hoodwinking us, and that nothing is over a few thousand years old, are about as small as the chances that the tree outside my window is going to fall before I finish this sentence. (It didn't.) The world may be inherently uncertain, but many things are worth trusting.
Thanks for reading!
Appendix: Simple example of a carbon dating calibration curve
If you have some background in statistics (and data visualization) here's a simple example of how a calibration curve is created. What makes it "simple" is its focus on just two kinds of data: C-14 in a sample, and C-14 in a tree located near that sample.
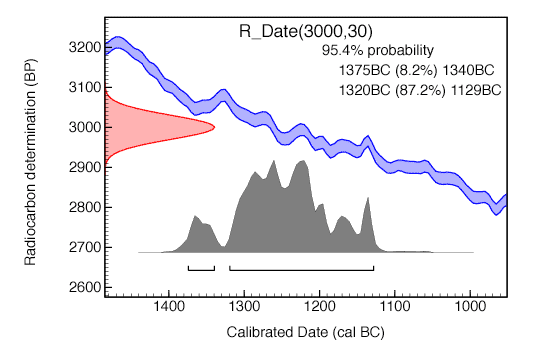
I'll be referring to the graph at the end of of this appendix, which was generated by the Oxford Radiocarbon Accelerator Unit at the University of Oxford.
The y-axis of the graph is number of years before present, as estimated by measurement of the proportion of C-14 in the sample. (Let's say it's a fern.)
The pink curve on the left acknowledges that there may be some error in the measurement of the C-14 (e.g., due to contaminants in the soil where the fern was found). A Gaussian distribution of error is assumed. The middle point of the curve marks 3,000 years before present. The estimate depicted by this curve encompasses the time range of 3,000 +/- 30 years before present.
The x-axis of the graph is actual calendar date. Notice that the further right you go on this axis, the more recent the date.
The purple region represents tree ring data that are being used to help calibrate the C-14 data. The region trends downward the further right you go, because over time the C-14 in the rings of the tree naturally diminish.
That purple region is marked by an upper line and a lower line. This acknowledges the possibility of error in the measurement of C-14 in the tree rings. At any point on the x-axis, if you look up, there's a two standard deviation difference between the upper and lower line.
If you were to draw a line from the upper edge of the pink curve straight across this graph, and another one from the lower edge of the pink curve straight across the graph, the places where these lines intersect the purple region would indicate the possible ages for the fern.
The gray area at the bottom indicates the intersection regions, with higher values indicating greater certainty.
Although you can't read this out of the visuals without running statistical analyses, we can calculate in this case, with 95.4% "confidence", that the fern existed between 1375 and 1129 BC.