

The Best Statistics of 2022

When you see a listicle like "The Best Movies of 2022", you know up front that "best" refers to a dimension such as artistic merit or entertainment value. But what would the best statistics be? In what sense could one statistic be better than another one?
In order to create this "statisticle", I looked at three characteristics of the stats I encountered this year: Credibility, positivity, and narrative force. (These are all, admittedly, very subjective dimensions.)
–Credibility is the extent to which the statistic seems to be accurate.
–Positivity refers to how much inspiration, or at least hope, can be found in the statistic.
–Narrative force refers to how much the statistic contributes to a broad, meaningful story.
In the Appendix I provide more information on this informal rating system. Here, arranged by topic, is my list of the "best" statistics of 2022:
Public health
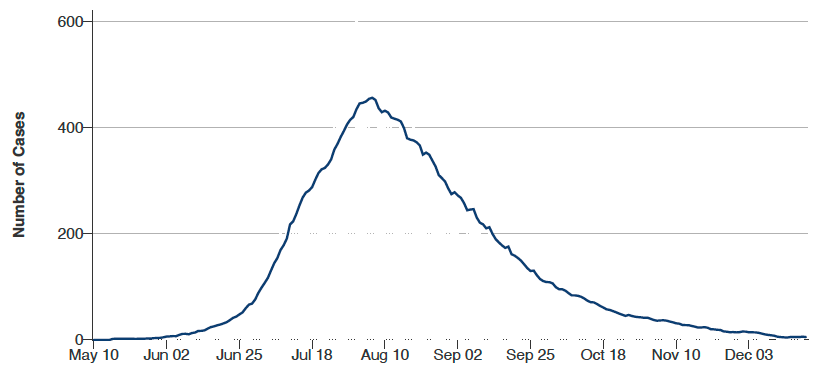
In a year of growing anxiety about a possible "tripledemic", the sharp decline in mpox case rates was great news. In the U.S., for example, there have been fewer than 10 new cases per day for over two weeks now (see figure below from the CDC website).
Stats on the prevalence of mpox are more credible than those for, say, COVID-19, because asymptomatic mpox is rare, and the symptoms more frequently lead people to seek medical attention.
Although declared a public health emergency by the WHO on July 23 and described by some as the next pandemic, people rarely talk about mpox now. The next step, along with continuing to prevent new cases, is to figure out exactly how we successfully contained the disease. Experts have already begun sifting through – and arguing about – evidence that vaccination, behavioral change, and immunity acquired through infections each play a role. Although the decline in mpox case rates has tremendous narrative force, we're still working out the details of that narrative.
Politics
In my view, the best political statistics of the year come from a December 14 Quinnipiac poll showing that Donald Trump is experiencing his lowest favorability ratings in over six years. (I did warn you that this would be a subjective list.)
The stats here are credible – Quinnipiac University polls are highly respected, and, unlike organizations such as Gallup, Quinnipiac doesn't enjoy direct financial gains from publicizing its results (e.g., the university doesn't receive external funding for polling or accept clients).In this particular poll, 1,614 adults were randomly selected for a phone interview. One might speculate that Trump supporters were underrepresented (as happened in the run-up to the 2016 election), because they wished to hide their Trumpism, but I'm skeptical of this possibility, because many of us – regardless of political affiliation – either don't answer calls from numbers we don't recognize, or, if we do answer, we decline to participate in polls, regardless of content. In other words, if the sample is biased, it's because it represents people who are especially patient, and eager to share their views. I don't think one political party can claim more of these people than the other.
Here are some key results: When given the choice between favorable, unfavorable, or "haven't heard enough" views of Trump, 31% of registered voters chose "favorable", while 59% chose "unfavorable". Among Republicans, the numbers were 70% favorable and 20% unfavorable. Among Independents, it was 25% favorable and 62% unfavorable. In each case, the percentages of favorable responses hasn't been that low since March 2016 or earlier.
Explanations for the erosion of Trump's popularity vary, but a downward trend is evident. And, even if you disagree with my politics, this shift is, as the man himself would say, big, very very big, in fact truly bigly, because Trumpism represents a distinctive approach to governance. It's not an approach most of us favor (political scientist William Connolly calls it "aspirational fascism"), but it's distinctive, and people of all political persuasions would agree that it makes a difference how much power is held by Trump and those who deploy similar approaches (Marjorie Taylor Greene, Herschel Walker, etc.).
To illustrate, compare Trump to another leading contender for the 2024 Republican nomination, Florida governor Ron DeSantis. I'm horrified by the prospect of Mr. DeSantis becoming our next president (he's currently outpolling Trump in hypothetical 2024 matchups), but unlike Trump and his ilk, Mr. DeSantis has extensive political experience, a keen grasp of policy, a willingness to talk policy even when it's not flashy, and a focused commitment to social change. Thus, one week ago today, while Trump was being mocked even by Fox News for a"major announcement" that turned out to be a new line of digital trading cards (see below), Mr. DeSantis was signing legislation that would reduce tolls for commuters by an estimated half a billion dollars in 2023.

Social Science
Homelessness in the U.S. is routinely linked to drug abuse. For instance, recent spikes in homelessness are attributed to the increasing availability and/or potency of drugs such as fentanyl and methamphetamine. This tendency is illustrated by a December 13 Fox News article entitled "Fentanyl and a stronger form of meth now driving American homeless crisis." (The subtitle of the article offers additional, grammatically incorrect clarification: "The highly addictive drugs have pushed users out onto the streets and unable to function normally.")
Blaming homelessness on drug abuse can be problematic when it amounts to blaming homeless people for their plight. It might also be inaccurate. In Homelessness is a Housing Problem, published in March of this year, Dr. Gregg Colburn and Clayton Page Aldern present statistically-based evidence that scarcity of affordable housing is the main driver of homelessness in the U.S. In other words, homelessness is not primarily caused by individual-level problems such as drug abuse, mental illness, or poverty, but rather by an unhealthy housing market. Economically booming coastal cities have attracted more skilled knowledge workers, and their arrival has increased demand for other skilled workers (educators, medical professionals, etc.) as well as those in service industries. But because affordable housing hasn't kept up with the influx of new residents, homelessness continues to increase.
This is not to deny that drug abuse causes some individuals to become unhoused. The point is simply that the high costs and scarcity of housing are more influential determinants. People in public spaces who appear to be homeless and high on drugs (and/or mentally ill) may be quite noticeable, but correlation doesn't prove causation. Some people who have become unhoused may turn to drugs as a coping mechanism, which means that for them it's not drug abuse that leads to homelessness but rather the opposite. Meanwhile, the market forces that Colburn and Aldern describe are less immediately visible but more influential; only via statistics and other forms of analysis can they be revealed. I rank these statistics among the "best" of 2022, because they not only show something about an important social trend, but also remind us to check our biases about homeless people.
Education
To be honest, I struggled a bit to identify the "best" educational statistics of the year, given how much concern there's been about learning loss, teacher shortages, student mental health challenges, absenteeism, attrition from urban districts, and other quantifiable impacts of the pandemic, not to mention the Uvalde massacre and other tragedies that ought to have been one-time occurrences but are so frequent they're now treated statistically by researchers (e.g., as distributions that vary across place and time).
In my experience, teachers, teacher educators, and educational professionals are resourceful, dedicated, empathetic, and collectively stronger than the recent pandemic. I predict that we'll soon see more than just anecdotal evidence that we've overcome so-called learning loss and other damage incurred over the past three years. In the meantime, what might turn out to be the statistical highlight of 2022 for education is the significantly greater amount of money available now for the "greening" of school districts, thanks to the Inflation Reduction Act, as well as the Infrastructure Investment and Jobs Act, and the American Rescue Plan. The new monies will be spent on environmentally-supportive changes (electric school buses, solar panels, energy-efficient renovations, etc.), but these changes will be noticed by parents, students, and educators, and thus they can provide great opportunities for learning – the sort of learning that may in turn promote future environmental health. This is another narrative waiting to be written, and it brings me to my final item for the week.
Environmental science
Increasing numbers of Americans recognize that climate change is (a) real, (b) harmful, and (c) strongly influenced by people.
Growing public awareness of these facts is a positive trend, in my view, because it increases the chances that people will change their own behavior, while pressing government agencies, legislators, and businesses to make environmentally-supportive changes too. It's also a much-needed trend. In the spring of this year, the Pew Research Center asked people in 19 countries whether climate change is a major threat to their country. 54% of Americans agreed – a slim majority, and the 18th lowest percentage among the 19 countries sampled.
At least some of the stats on American attitudes toward climate change are credible, given their consistency across surveys. For example, the percentage of Americans who recognize that climate change is real ranges from 71% to 83%, depending on which of three independently-conducted 2022 surveys you examine. In each case, the figures are higher than what's been found in previous years.
Unfortunately, the percentage of Americans who think that climate change is at least partly anthropogenic (i.e., caused by people) is consistently less than the percentage who believe that it's real. If there's any good news here, it's that over half of Americans do recognize that climate change is anthropogenic, though here again, it's a slim majority. (For other climate-related questions, survey results have been inconsistent.)
Although surveys continue to reveal connections between political affiliation and beliefs about climate change, I don't think those connections are as strong as often portrayed. Rather, Democrat-Republican differences seem most pronounced when climate change is framed in political terms. For example, back in January, the Pew Research Center asked people whether various issues "should be a top priority for the president and Congress to address this year." 65% of Democrats but only 11% of Republicans indicated that "dealing with global climate change" should be a top priority. That's a big difference, but it stems from a question that treats climate change as a political issue (and the word "global" may have inadvertently triggered some respondents to view this as more of a question about U.S. involvement in international affairs than a question about climate per se).
On the other hand, a separate survey, conducted by Pew in May, shows that when people whose communities have experienced extreme weather are asked whether climate change played a role, a majority of people from both parties acknowledge that it did. The Pew survey asked about severe weather (floods or intense storms), hot weather, droughts, wildfires, and rising sea levels. In each case, 95 to 97% of Democrats, and 65 to 87% of Republicans indicated that climate change was partly to blame. Those are small differences compared to what we see for politically-focused questions. (Notice too that the percentages are relatively high among both parties. People recognize the concrete effects of climate change. It's just that, politically speaking, they care about other things too.)
In sum, 2022 has seen growing public awareness of the threats of climate change and the role that people play. This trend needs to continue. The fact that the partisan gap is greatest when climate change is framed as a political issue is troubling, because solutions to climate change must be, in part, political, though it also reminds us that educators, policy advocates, and anyone else who seeks bipartisan cooperation will have greater success by emphasizing impacts rather than political ideology.
More "bests" next week. Thanks for reading!
Appendix: My rating "system"
To illustrate more of what I have in mind by credibility, positivity, and narrative force, here are two of the statistics that did not make my list:
1. According to the most recent data, the poverty rate in the U.S. has reached a record low.
Specifically, in September, the U.S. Census Bureau reported a poverty rate of 7.6% for 2021, which is lower than any percentage reported since 1965, when poverty thresholds or "lines" were first adopted by the federal government.
At first glance, this seems like an ideal candidate for "best statistic". It seems credible, given that poverty thresholds are objectively defined. It seems positive, in the sense of being a record low. And, it seems to have narrative force as an indicator of improvements in standards of living among poorer Americans. However, each of these assessments falls apart upon closer scrutiny.
(a) With respect to credibility, I don't fault the Census Bureau for this – what they do is extraordinarily difficult – but there's considerable room for error. The formulas are complex and based in part on self-report data. People who live in nursing homes, military barracks, and other nonconventional residential settings aren't counted, and an additional 5% or so may be simply missed.
(b) The positivity of the 7.6% statistic diminishes when you consider that it's attributable in part to federal COVID-19 relief efforts, including stimulus checks and an expanded child tax credit, both of which have ended already. In other words, what we're seeing may turn out to be a temporary boon.
(c) The 7.6% statistic has limited narrative force. It shows that a temporary influx of cash lifts people out of poverty, but we knew that already, because the amount of cash people have on hand is part of what determines whether they fall above or below the poverty line.
2. As of this morning, Kim Kardashian now has over 336.5 million Instagram followers. (Exciting, right?)
I find this statistic highly credible – I have no reason to doubt its accuracy. It also has some narrative force, in the sense of hinting at the cultural importance of social media influencers. (Apart from China and India, no country in the world has more people than Ms. Kardashian has followers.) But I don't find the statistic especially positive (i.e., inspiring or hopeful). Although it does tell you that working hard at becoming popular can make you popular, particularly when you're charismatic and affluent, I think we knew that already.