


The Great Crime Disconnect: Part 1


Interpreting data can be like listening to a 3-year-old talk about their day. At first it all makes sense, but then there's a giraffe, and chocolate sneakers, and other details that complicate the narrative until you're left wondering what really happened.
Experts agree that crime in the U.S. has sharply declined since the 1990s, a phenomenon sometimes called the "great crime decline". However, the American public tends to believe crime has been increasing.
That sounds like a pretty simple narrative. I call it the "great crime disconnect", because for much of the past two decades, public perceptions seem to have conflicted with the data.
As you'll see, there are some giraffes that raise questions about both parts of this narrative.
The great crime disconnect
What sparked my interest in this topic is an April 11 article published in Scientific American, which begins like this:
"Americans are convinced that they are living in a world ravaged by crime... The overwhelming consensus is that crime is only getting worse. According to a Gallup poll, in late 2022, 78 percent of Americans contended that there was more crime than there used to be.
These perceptions would make sense if they were accurate, but they aren’t. Crime, in fact, is down in the U.S., rivaling low levels that haven't been seen since the 1960s."
This passage troubled me. 78 percent doesn't seem like an "overwhelming consensus." Gallup seems unlikely to pose a vague question about how much crime "there used to be". And it seems too simple to say that crime is "down". Wouldn't that depend on location and type of crime? Just this morning, Wired described how face-swapping technologies are being used in online romance scams. How could crimes like this be decreasing when they've only just begun?
I decided to have a look at the data. In this newsletter I'll address two questions:
1. Are U.S. crime rates decreasing?
2. Do Americans actually think crime rates are increasing?
The answer to both questions will be "yes", although a few giraffes will show up to complicate things a bit.
My focus this week will be fairly narrow and data-oriented. Next week, I'll discuss the broader issue of why crime has been declining in the U.S. and other countries over the past three decades, and why public opinion hasn't seemed to reflect that change.
Why is this topic important?
Perceptions of crime rates influence who we vote for and what we press our elected officials to do. In a March 26 Harvard CAP-Harris poll, when American adults were asked to choose the most important issues facing the nation, the category "crime and drugs" ranked 4th, higher than health care, women's rights, education, or climate change. (Even that ranking may be an underestimate, given the crime-related nature of other categories such as "school safety", "cybersecurity", and "terrorism/national security".)
Perceptions of crime also influence our personal behavior, such as where we choose to live and spend our money, where we allow our kids to hang out, and so on.
Finally, as I explain in the Appendix, the great crime disconnect weaves together two of the most important historical contributors to modern statistical practice. It's an idea that would've been largely incomprehensible prior to the 19th century.
1. Are U.S. crime rates decreasing?
As you might expect, the answer depends on the area, the type of crime, the time period in question, and the source of data. I won't overwhelm you with details. I just want to share a few themes.
(a) Crime rates are measured in more than one way.
Two key sources of national crime data are the FBI's Uniform Crime Report (UCR) program, and the Bureau of Justice Statistics' National Crime Victimization Surveys (NCVS).
The UCR was established in 1929 and receives voluntarily-reported data each year from roughly 18,000 law enforcement agencies.
The NCVS was established in 1972 and consists of annual surveys, administered by the Census Bureau, to roughly 150,000 households.
I'll say more about these sources later. For now, I just want to emphasize that the UCR data covers reported crimes, while the NCVS also includes crimes that were never reported to law enforcement agencies.
(b) Crime rates have been declining since the 1990s.
Here I'll let two figures tell the story.
The figure below, created by Statista to depict violent crime trends, is drawn from UCR data.
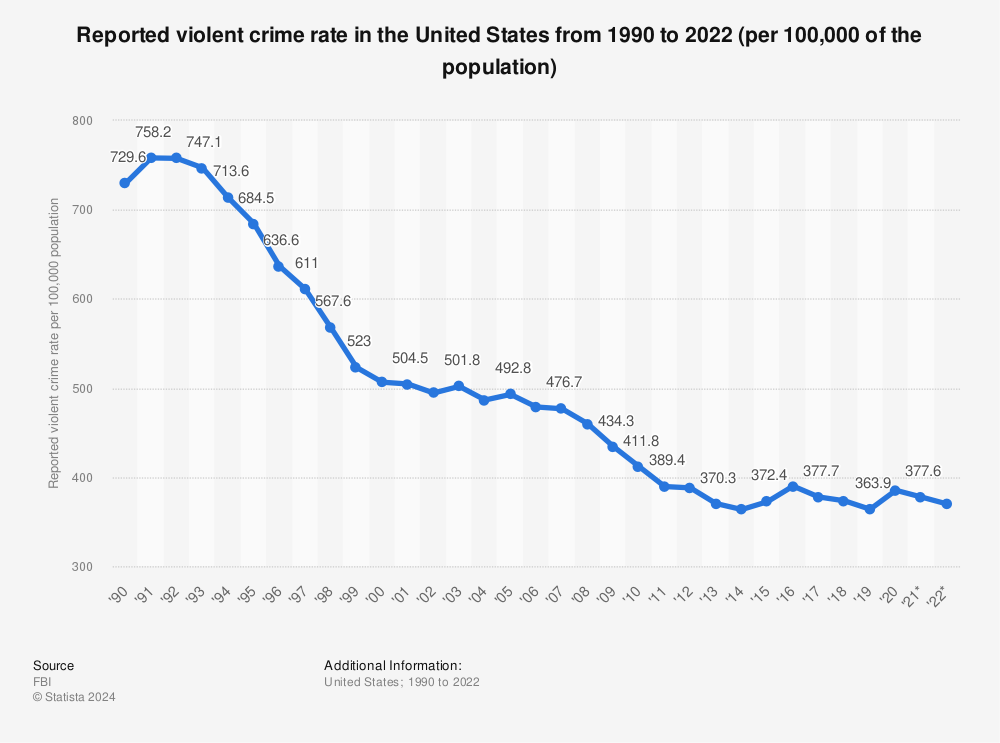
This figure shows that since 1990, the incidence of reported violent crimes has steadily declined to slightly less than half of its peak levels. (Quarterly data released by the FBI last month indicates that for 2023, the decline continues.)
The line is not perfectly smooth. For instance, in 2020 there was a spike in violent crime (often linked to the pandemic, or to Donald Trump's presidency, or to a combination of the two). However, as you can see, this spike is not large in the context of the broader historical trend.
The figure below, created by the Pew Research Center to depict property crimes, shows UCR data on the left and NCVS data on the right.
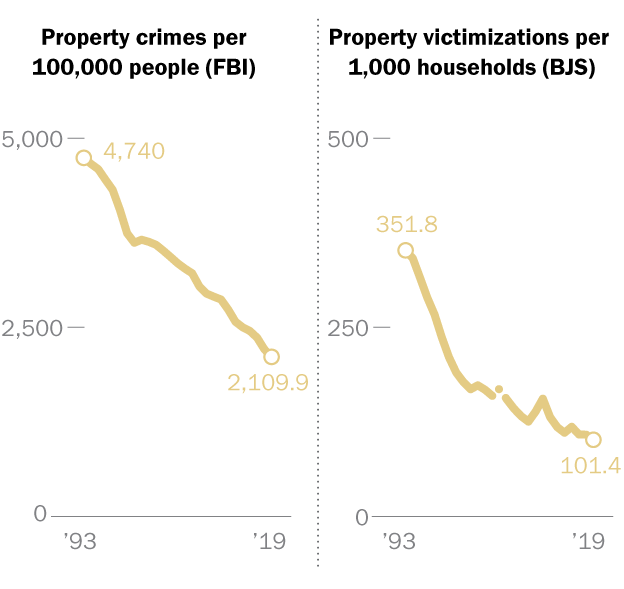
Here again you can see a steady decline from the early 1990s through the present, with current rates of property crimes less than half of what they were at the beginning of this time period. (The data for 2019-2023 includes a spike in the midst of the pandemic, but again, as with the violent crime data, there's an overall downward trend).
The long-term trends illustrated in these figures have been observed for every category of major crime.
(c) Downward trends in crime rates aren't consistently reflected in political discourse.
2024 is arguably one of the most important election years in American history, from the presidential race on down. I think it's useful to keep in mind what the data can tell us.
Last week Congresswoman Nancy Mace (R-South Carolina) posted a video to X accompanied by the text"Since Joe Biden took office, crime has skyrocketed around the country." Other Republican leaders, including Donald Trump, have made similar remarks.
These claims are clearly inaccurate. National crime rates have declined each year President Biden has been in office for every major category of crime other than auto theft and, in 2022, property theft. (I'm not saying anything about how much credit the Biden administration deserves for this. My point is simply that crime rates have declined overall in each year of the Biden presidency. Call it a coincidence if you wish.)
If Republican politicians had merely said that "crime in the U.S. is out of control", the data I've shared with you would not prove them wrong. What constitutes "out of control" is a subjective call. But any statement about crime increasing in recent years will tend to be wrong.
(d) There are exceptions to the overall downward crime trends.
Because crime is undesirable, exceptions to the rule – those minor upticks in otherwise downward trends – are important for both scientific and practical reasons. Here are three examples:
(i) Murder rates in the U.S. showed a record increase in 2020, as you can see from the Statista graph of UCR data below.
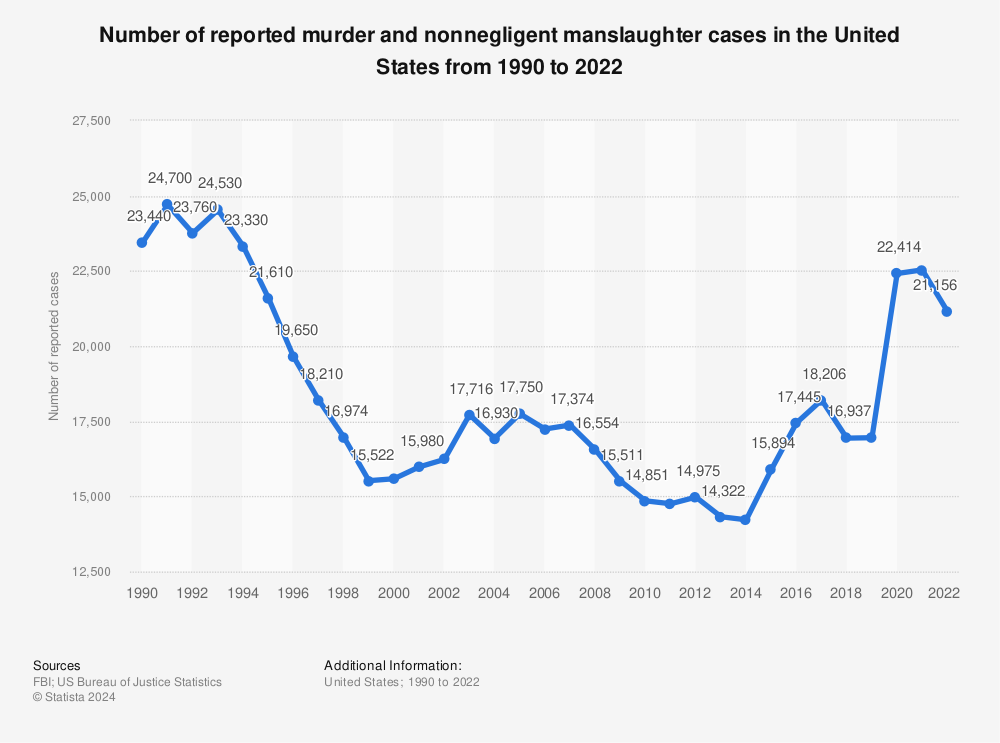
(Since 2022, the national murder rate has continued to decline, though still not reaching pre-pandemic levels. In 2023, the murder rate showed the largest single-year drop in history; 2024 is already on track for even lower rates.)
(ii) Not all regions reflect national trends. For instance, in 2023 murder rates declined nationally but rose in some cities, such as Dallas (15% increase), Washington DC (35% increase), and Memphis (38% increase). Even more variability can be seen at the neighborhood level, and when type of crime is factored in. Although murders increased in Dallas last year, for example, violent crime overall decreased by 13% in the city.
(iii) Type of crime matters. For instance, auto thefts increased substantially in 2022 and remained high in 2023. Jeff Asher has linked the surge to a TikTok video demonstrating an easy way to hot-wire Kias and Hyundais. Wherever data are available, Asher found that the proportion of stolen cars made by these companies rose dramatically after the video went viral, independently of changes in overall rates of auto theft. (Regardless of what sort of vehicle you own, you may be happy to know that earlier this year Mr. Asher projected a decline in auto thefts for 2024.)
(e) Measurement of crime rates is inherently imprecise.
Here's where some giraffes enter the discussion. We don't understand crime rates as clearly as they're typically portrayed.
The FBI's URC program only obtains data from roughly 80% of law enforcement agencies. This is data on reported crimes. Thus, information is missing from some agencies, and there's no data on crimes that go unreported. (Evidence from the FBI and other sources suggests that over 50% of crimes are never brought to the attention of law enforcement.)
The Bureau of Justice Statistic's NCVS obtains data on both reported and unreported crimes, but only a small percentage of Americans are sampled (roughly a quarter of a million people age 12 or older, which is less than one thousandth of the population). Representative but small samples like this are better suited for documenting long-term trends as opposed to identifying absolute rates of crime (or any other variable).
Added to this is muddiness arising from periodic changes within each agency in how crimes are defined, reporting biases, ongoing revisions of prior estimates, and, on rare occasions, substantial discrepancies between UCR and NCVS data.
(Ideally the two databases would corroborate or at least complement each other, but at a granular level they don't fit together well. For instance, UCR includes murders but NCVS does not (dead people don't complete surveys). UCR concerns victims of any age, while NVCS surveys people 12 and up. UCR data is gathered for each calendar year, while NCVS asks about victimization over the past six months, which may or may not include crimes experienced during the previous calendar year.)
I reached out to Jeff Asher to get his views on the reliability of the UCR and NCVS data. Mr. Asher is a leading expert on criminal justice data who's regularly interviewed by national news organizations (New York Times, Wall Street Journal, Slate, NBC, etc.) for articles on crime rates. I asked Mr. Asher what made him most confident about recent trends in the data, given the known limitations of the UCR program and NCVS surveys. Here's his response:
"The most substantial recent trend is the decline in murders nationally and that is unaffected by UCR/NCVS limitations for two reasons. First, murder is one of two crimes (the other being auto theft) that is strongly reported. I'd argue that the vast majority of murders are successfully reported to the police each year. And second, the national murder trend does not solely rely on FBI UCR data as it is matched by publicly available city data, data on homicides from the CDC, and shooting data from the Gun Violence Archive. Combined these sources provide strong confidence that the murder trend is quite trustworthy."
So, high confidence at least about declining murder rates. I would add that even though the UCR and NCVS data diverge for specific years, sometimes to a substantial degree, they both point to that overall, three-decade pattern of decline.
In sum, I don't think there's cause to doubt the reductions in national crime rates reported since the 1990s. Rather, what's doubtful is the precision of any specific estimate. As Mr. Asher pointed out to me,
"Because crime trends tend to change slowly… more meaningful trends are usually derived over the longer term of a few years rather than from year to year."
In other words, giraffes invade the narrative to the extent that you cite specific statistics, or compare one year to the next. In a way this doesn't feel very satisfying – descriptive statistics are specific numbers. But hewing too closely to those numbers can lead to false precision.
In 2021, The Atlantic published an article by Derek Thompson (who writes brilliantly about contemporary work) entitled "Why America’s great crime decline is over". It wasn't over. A title like that was only possible because Mr. Thompson was writing one year after the 2020 spike in crime. This increase is continuing to subside, and in any case it never did elevate crime rates to what we experienced in the early 1990s.
As Mr. Asher puts it in his Jeff-alytics newsletter, "When talking about crime data, estimative language is our friend!...The trend is what matters, not the exact numbers for each year."
2. Do Americans think crime rates are increasing?
For over two decades, Americans have been described as mistakenly believing that crime in the U.S. is increasing. There has never been an "overwhelming consensus", as the Scientific American writer put it, but still, many people appear to be out of touch with the actual trends.
The figure below shows Gallup's own data on perceived crime rates. The upper line (dark blue) is the data for perceptions of worsening crime at the national level.
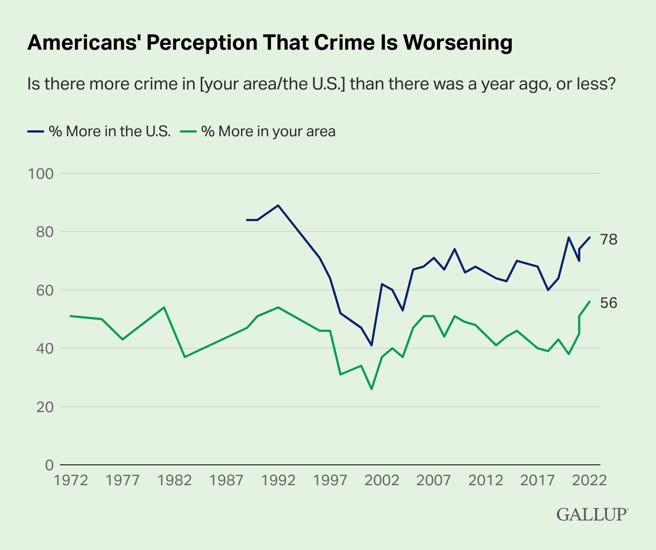
You can see that during the 1990s, as actual crime rates dropped, the percentages of people who mistakenly thought that crime was increasing dropped too. In other words, fewer and fewer people were wrong about the national trends. Still, that dark blue line never dips below 40%, and following the turn of the century (in response to 9/11, according to some experts), the figure rises to 78% in 2022 and 77% in 2023 (not shown).
Observers routinely take this as evidence that many or most Americans have been continuously wrong about national crime trends. This is a sensible interpretation, crudely speaking, but Gallup's question pertains to "crime" in general. For those occasional years when there were increases in at least some types of crime (e.g., 2020), that blue line doesn't represent an altogether incorrect response. I'll be revisiting this point next week.
Now for a pair of giraffes. As with actual crime data, I don't think our view of public perceptions is as clear as typically assumed.
(a) Gallup uses a dichotomous question format.
In the Gallup poll, the only options are more vs. less: "Is there more crime in the U.S. than there was a year ago, or less?". We don't know how many people would say "no change" if given the opportunity.
Gallup records no-change responses, but descriptions of it have been inconsistent. For instance, in 2011, Gallup acknowledged that some people spontaneously "volunteered" a no-change response. In 2015, the organization presented "no change" as a formal response option in their public report. By 2020, the option has disappeared from the report, but a data file reveals that it has always been recorded when volunteered as an option. The percentages of respondents spontaneously saying "no change" has ranged from 5 to 14% depending on year.
The key point here is that these percentages would've surely been even higher if people had been offered a "no change" option rather than having to speak up. For most years since the early 1990s, a no-change response would be less inaccurate than a more-crime response.
I would also argue that accuracy is defined too stringently here. A no-change response during a year when crime rates declined only slightly from the previous year isn't really inaccurate, given the extent of imprecision in crime rate estimates. In fact, you could make the case that "no change" is more accurate than "less crime" when the decline in violent crimes and other categories is just a few percentage points, because there's too much margin for error in yearly estimates (cf. Jeff Asher’s remarks above).
(b) Gallup's data is not internally consistent.
Since 2005, at least 60% of Americans surveyed each year have told Gallup that crime was worse than it had been the previous year.
If the majority of us have truly believed this for nearly two decades, you would expect that over time we'd be viewing crime as an increasingly serious problem. In fact, such a pattern is not observed at the national level. For example, check out the figure from Gallup below.
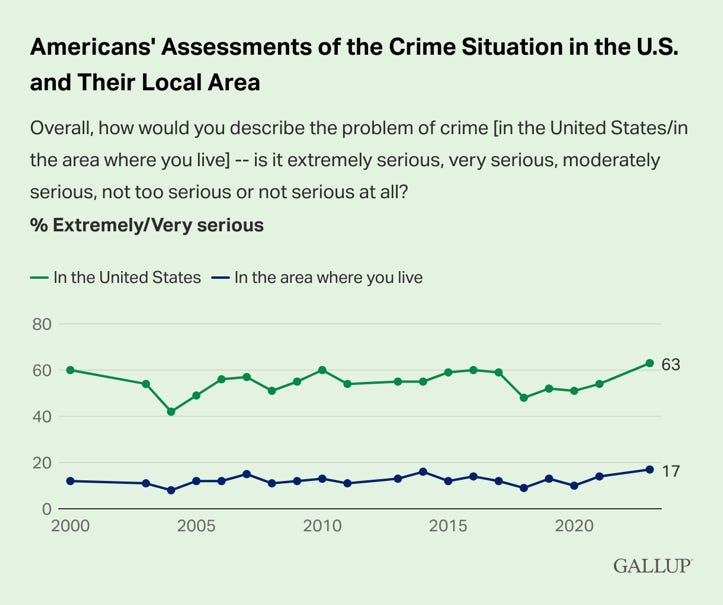
The green line on top shows the data for national crime rates – specifically, it's the percentage of people who consider crime to be an "extremely" or "very" serious problem in the U.S.
As you can see, from 2005 through the present, the line is close to flat, with a slight uptick around 2020. This is not consistent with the notion that every year, people were thinking that crime was worse than it had been the previous year.
Next week I'll discuss more interpretive issues with polls from Gallup and other organizations. My point here is not that Gallup is completely wrong about public perceptions. It does appear that a substantial proportion of Americans mistakenly believe that crime is increasing. But the "penguins" I mentioned, taken together, suggest a fair amount of uncertainty about how many of us are wrong.
(To be continued...)
Thanks for reading!
Appendix: Statistical contributors to the great crime disconnect
The notion that earlier generations were morally superior to the current one is a common refrain. Two thousand years ago, Hesiod wrote of living in the iron age, a crime-ridden era far removed from the golden age of humanity.
The great crime disconnect – i.e., the incorrect assumption that crime is increasing – might seem like a distant offshoot of this way of thinking, but I doubt it would've been comprehensible to Hesiod or most anyone else prior to the 19th century, because it derives from two of the main historical contributors to modern applied statistics.
1. The term "statistics" comes from the German word "Statistik", first used in the mid-18th century by political scientist Gottfried Achenwall in reference to how we might describe the conditions of a state (i.e., Staat). This included things like census data, useful for determining things like tax rates, or the number of males eligible for military service. By the 19th century, sociologists were systematically documenting crime rates as well.
In short, "statistics" originally referred to the kinds of information leaders and bureaucrats need to know in order to administer a state, including data on crime. However, counting crimes isn't easy. 19th century sociologists looked at the composition of prison populations but were well aware that they were failing to document crimes committed by perpetrators who weren't caught. Modern statistics, which mostly emerged in the early 20th century, provided more accurate techniques for estimating crime rates, including the survey methods of the NCVS and the inferential analyses used for both URC and NCVS data. (And yet, the FBI's UCR program still contends with the 19th century problem that data on who gets caught is an unreliable guide to how many people get away.)
2. Efforts to understand public perceptions of crime can be traced back to the early decades of the 20th century and the emergence of the first public opinion polls. Social scientists, political canvassers, and business owners each had reasons for wanting to know about American's attitudes. In the 1930s, for instance, George Gallup developed the first successful political poll relying on new approaches to sampling developed by the early statisticians.
In sum, discussions of the great crime disconnect emerge from a combination of 18th century statecraft and 20th century techniques for gathering and interpreting data on actual as well as perceived crime rates.